
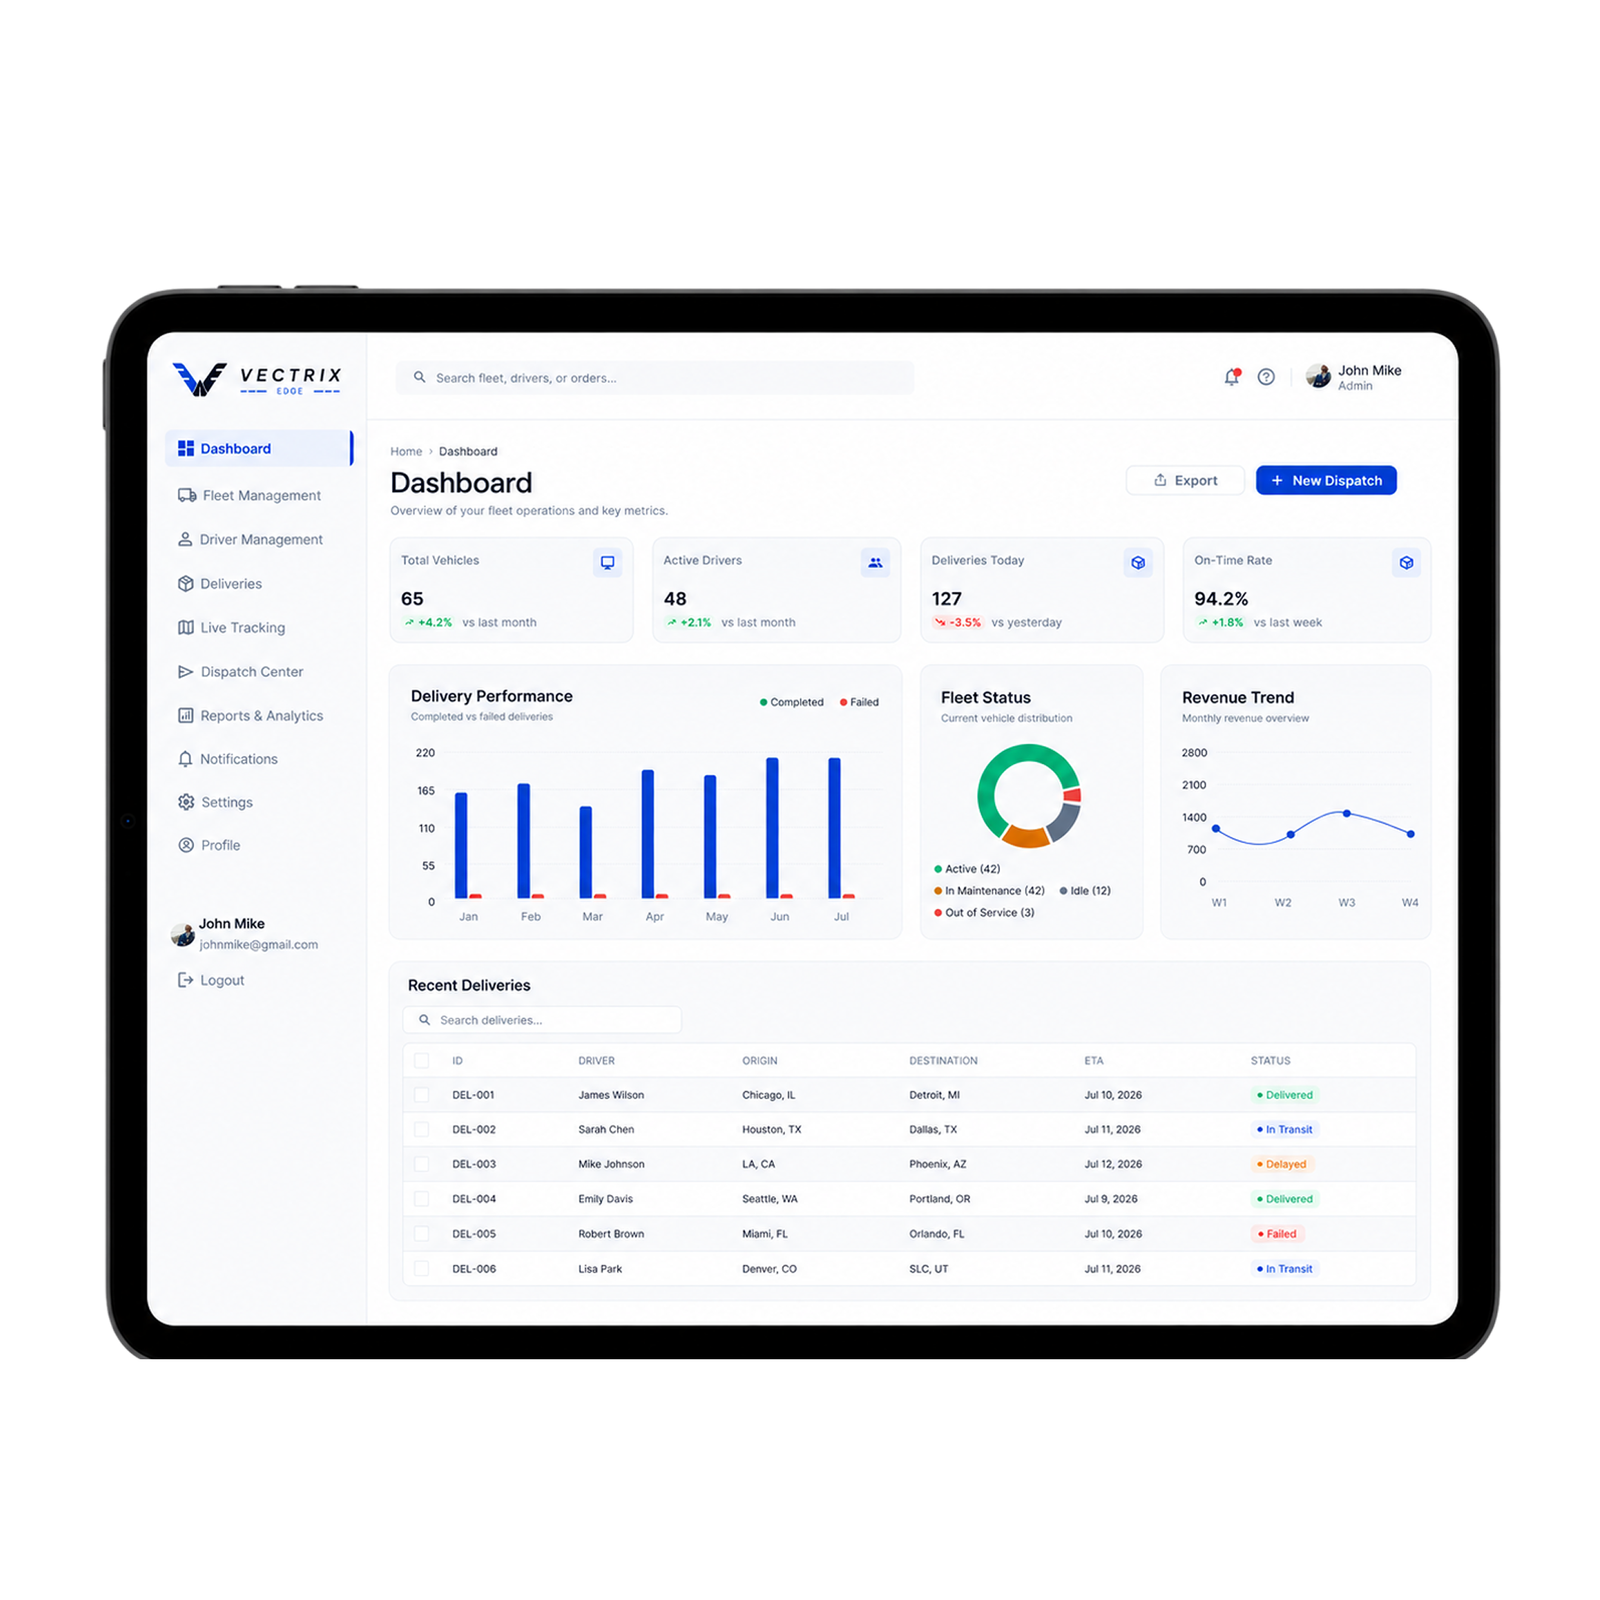
Designing Fleet Dashboards That Turn Operational Data Into Decisions
A useful fleet dashboard does more than display activity. It reveals what needs attention, why it matters and which decision should happen next.
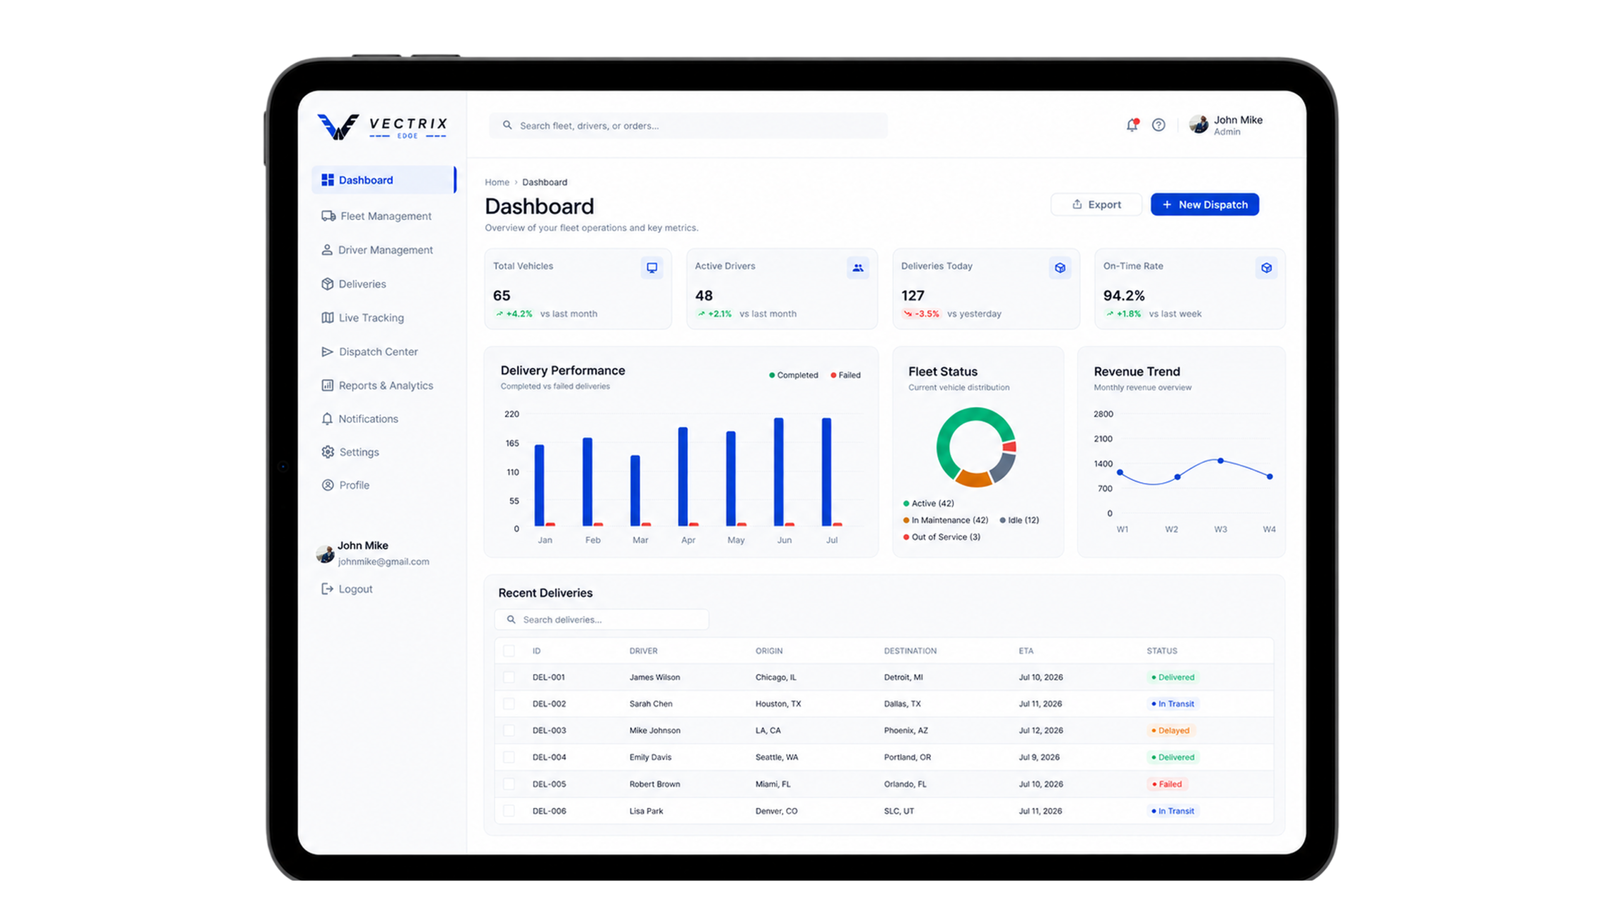
Fleet dashboard design is often treated as a data visualisation exercise: collect telematics, place metrics into cards and add a map. That approach can produce an impressive screen while leaving dispatchers, fleet managers and executives unsure what requires action.
Operational teams do not need every available data point at equal volume. They need a decision environment that separates normal activity from risk, connects exceptions to context and makes the next responsible action clear. The dashboard must compress complexity without removing the evidence needed to make a sound judgement.
The best fleet interfaces are therefore organised around operational questions rather than database fields. What is off plan? Which asset or route is affected? What is the likely operational consequence? Who owns the response? What changed after intervention?
What Makes a Fleet Dashboard Operational
Priorities Over Volume
Lead with the few conditions that can change service, safety, cost or utilisation today.
Exceptions With Context
Pair alerts with route, driver, vehicle, history and consequence so teams can judge urgency.
One Operational Language
Use consistent definitions for status, delay, utilisation, risk and completion across roles.
Actionable Resolution
Every important signal should connect to an owner, a next action and a visible outcome.
A Dashboard Should Reduce Decision Latency
Fleet operations unfold across vehicles, drivers, routes, depots, customers and external conditions. When these signals are presented as unrelated widgets, the user must reconstruct the operating story manually. That creates cognitive load and slows response at exactly the moment clarity matters.
A decision ready dashboard uses hierarchy. The first layer communicates fleet health and the small number of exceptions that need attention. The second layer explains impact and contributing context. The third layer supports investigation, assignment and resolution. Users should be able to move from signal to evidence to action without switching between disconnected systems.
Different roles require different decisions
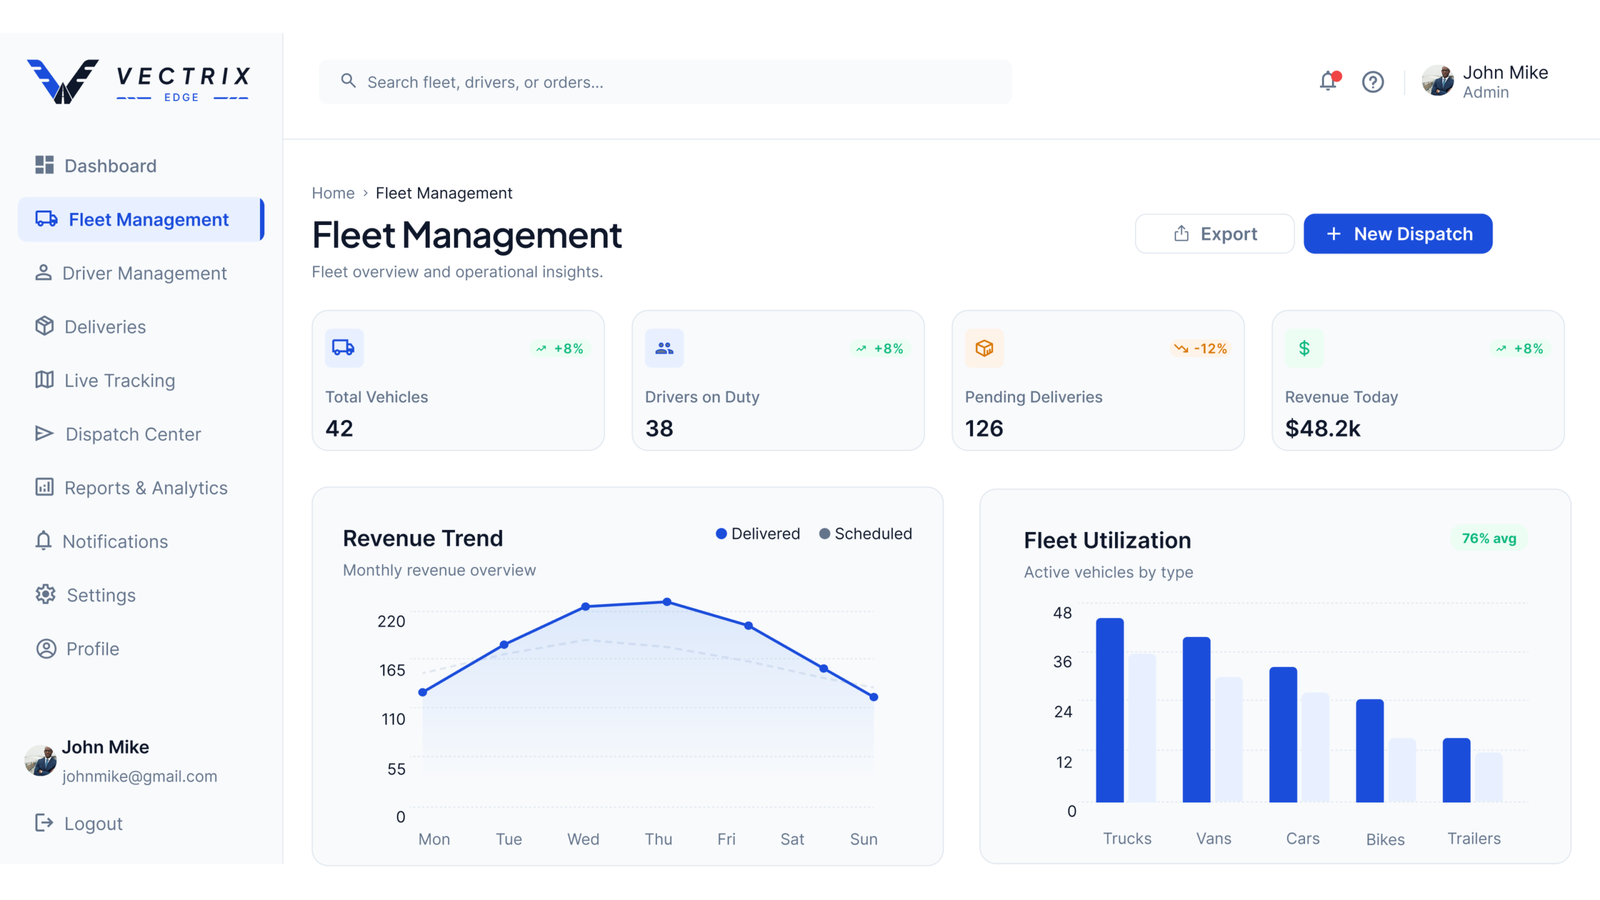
An executive may need utilisation, cost trend and service reliability. A fleet manager needs maintenance exposure, asset availability and driver performance. A dispatcher needs live route exceptions, assignment capacity and communication status. Reusing the same dashboard for every role usually creates noise. A shared data foundation should support role specific views and permissions.
Maps are context, not the whole product
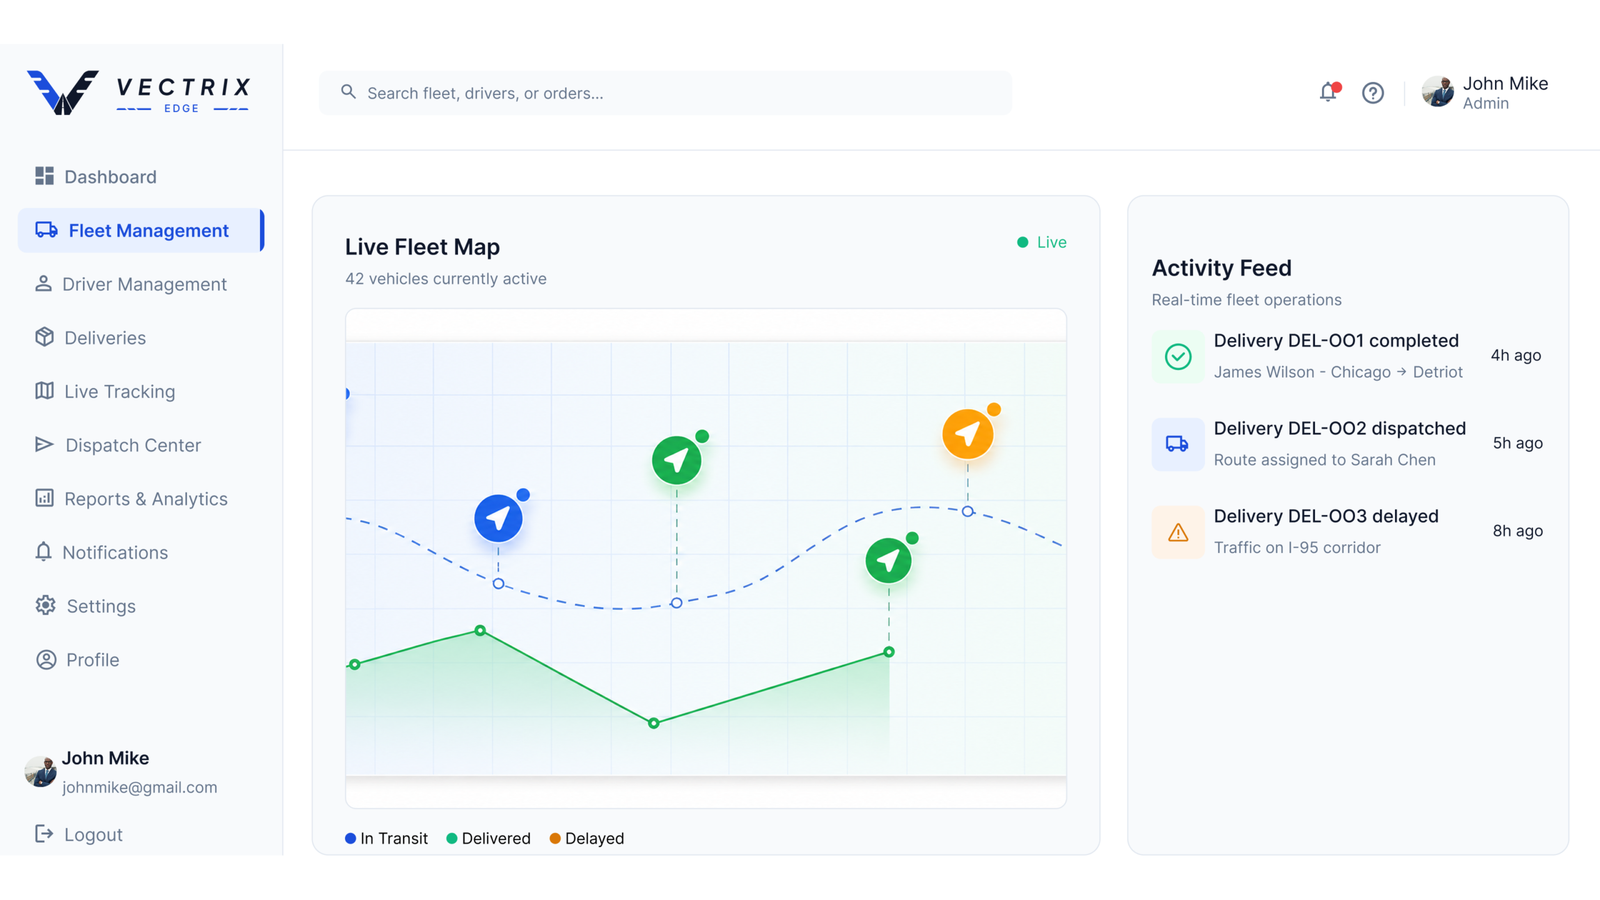
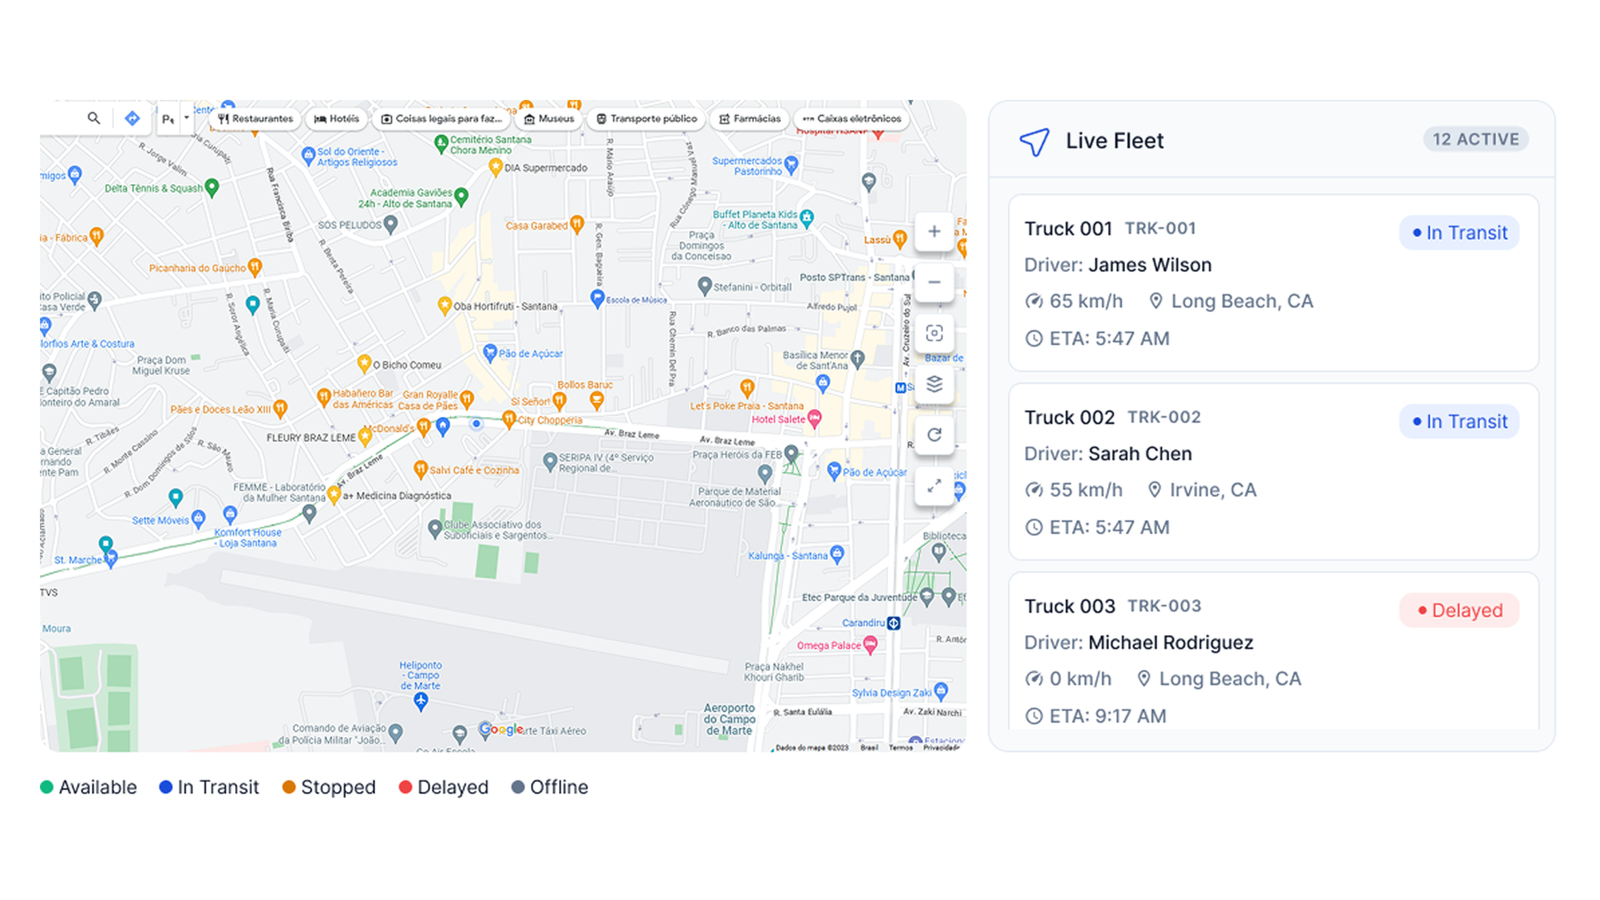
A map can answer where, but not always why or what next. Location becomes operationally useful when connected to route progress, promised arrival, traffic conditions, driver status and customer impact. The design should allow geographic context without forcing every workflow through a map.
From Telemetry to Operational Meaning
Raw telemetry becomes useful only after the product applies definitions, thresholds and business context. A vehicle idling for ten minutes may be normal at a depot and costly on an active route. A maintenance alert may be informational for one asset and service critical for another. The interface needs rules that reflect the operation rather than simply displaying sensor events.
This requires collaboration between product designers, fleet operators, engineers and analysts. Teams should define each metric, its owner, its refresh rate, its acceptable range and the action associated with an exception. Those definitions become part of the product system and prevent different departments from interpreting the same number differently.
Historical context is equally important. Showing whether an exception is new, recurring or already acknowledged helps teams avoid duplicate work. Resolution history also turns the dashboard into an organisational learning tool rather than a temporary monitoring screen.
Explore the Vectrix fleet operations platformOperational visibility is not the number of metrics on screen. It is the speed and confidence with which a team can recognise and resolve what matters.
The SIGNAL Framework for Fleet Dashboards
Select
Start with decisions that materially affect service, safety, cost and capacity.
Identify
Distinguish normal operations from exceptions using explicit thresholds and states.
Ground
Attach every alert to route, vehicle, driver, history and customer context.
Navigate
Provide an accountable path from detection through assignment and resolution.
Assess
Show what changed after action and whether the operating condition returned to normal.
Learn
Use recurring exceptions and resolution history to improve rules, planning and product design.
How to Improve an Existing Fleet Dashboard
List the decisions each role makes daily before selecting metrics.
Replace undifferentiated alert feeds with prioritised exceptions and ownership states.
Connect every critical signal to route, asset, driver, history and customer impact.
Document definitions, thresholds, refresh rates and escalation rules.
Measure whether the dashboard reduces investigation time and duplicate work.
Design responsive mobile actions for teams working away from a control room.
Have a question about this insight?
Send Lokomax a focused question about the product, workflow or design decisions covered in this article.
Turning fleet data into an operating advantage?
Lokomax designs logistics dashboards, fleet portals and mobile workflows that help operational teams see priorities and act with confidence.